File list
This special page shows all uploaded files.
| Date | Name | Thumbnail | Size | Description | Versions |
|---|---|---|---|---|---|
| 15:18, 21 March 2010 | Figure5.png (file) |  |
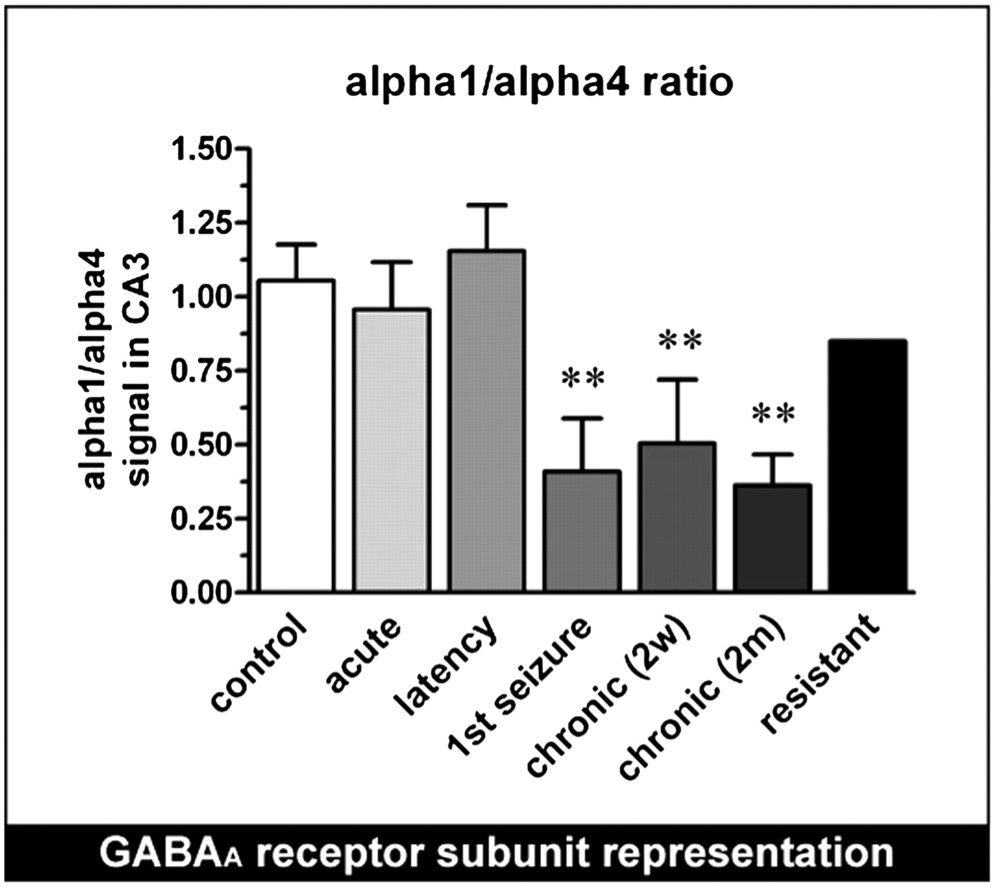
248 KB | Figure 5. Relative representation of the alpha1 and alpha4 subunits in CA3, at various time points after pilocarpine-induced SE (Mazzuferi 2010) | 1 |
| 15:15, 21 March 2010 | Figure4.png (file) |  |
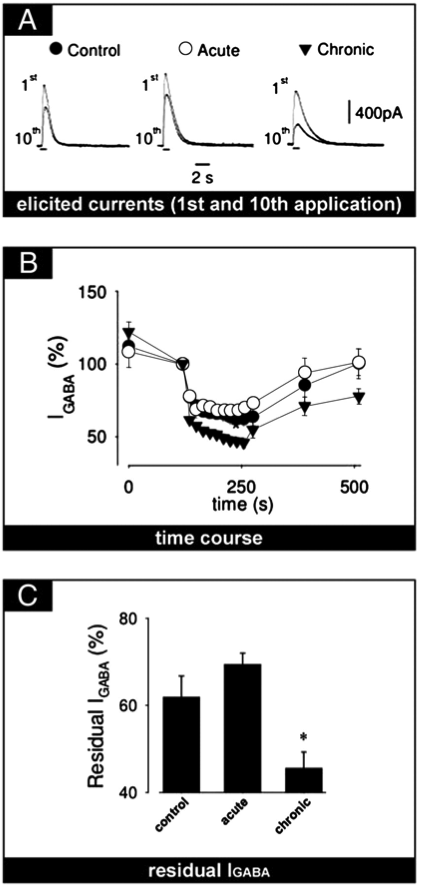
99 KB | Figure 4. Different IGABA run-down upon repetitive stimulation in CA3 pyr- amidal neurons in hippocampal slices from control rats, pilocarpine-treated rats in acute phase (24 h after SE) and chronically epileptic rats (Mazzuferi et al. 2010) | 1 |
| 15:06, 21 March 2010 | Figure3.png (file) |  |
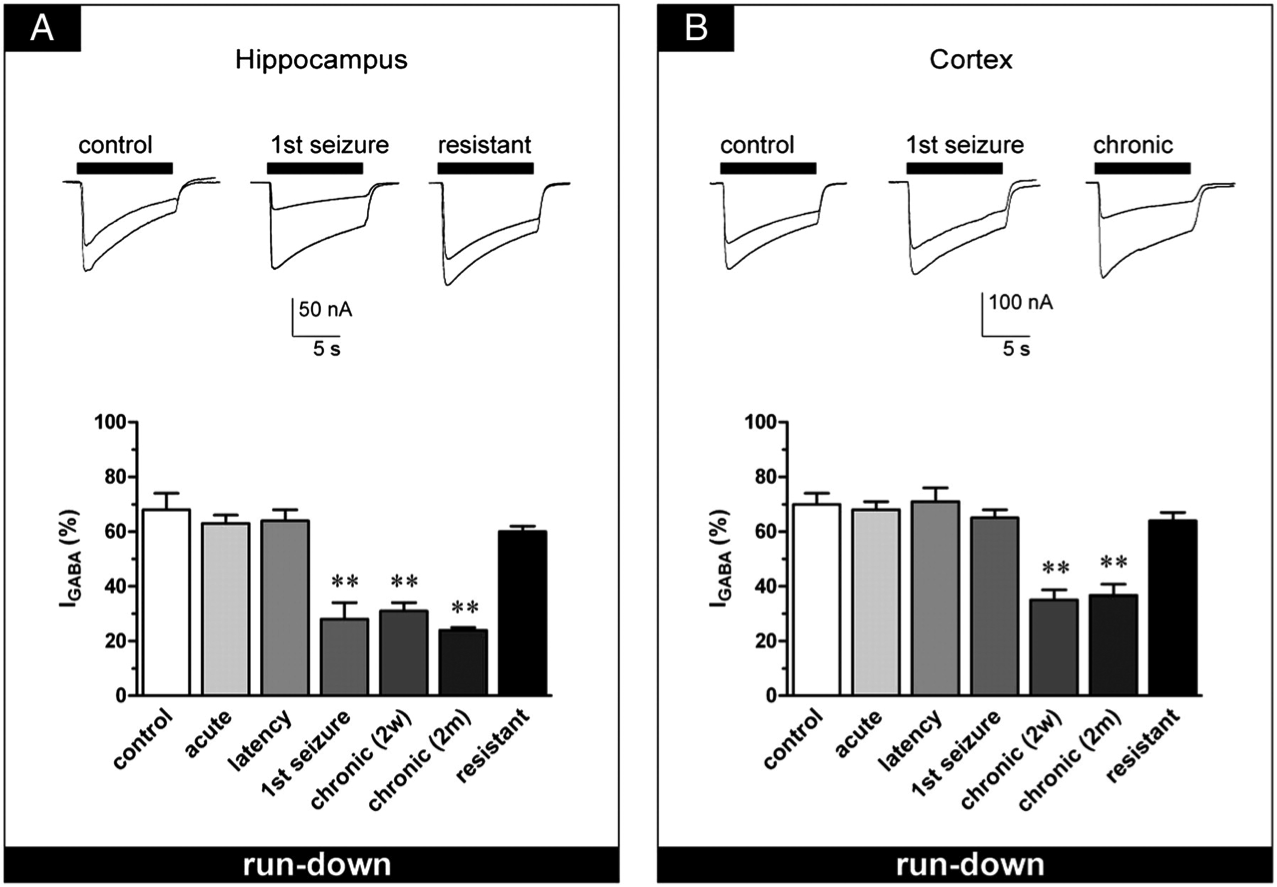
253 KB | Figure 3. IGABA run-down from oocytes injected with membranes prepared from rats killed at various time points after pilocarpine-induced SE (Mazzuferi et al. 2009) | 1 |
| 15:04, 21 March 2010 | Figure2.png (file) |  |
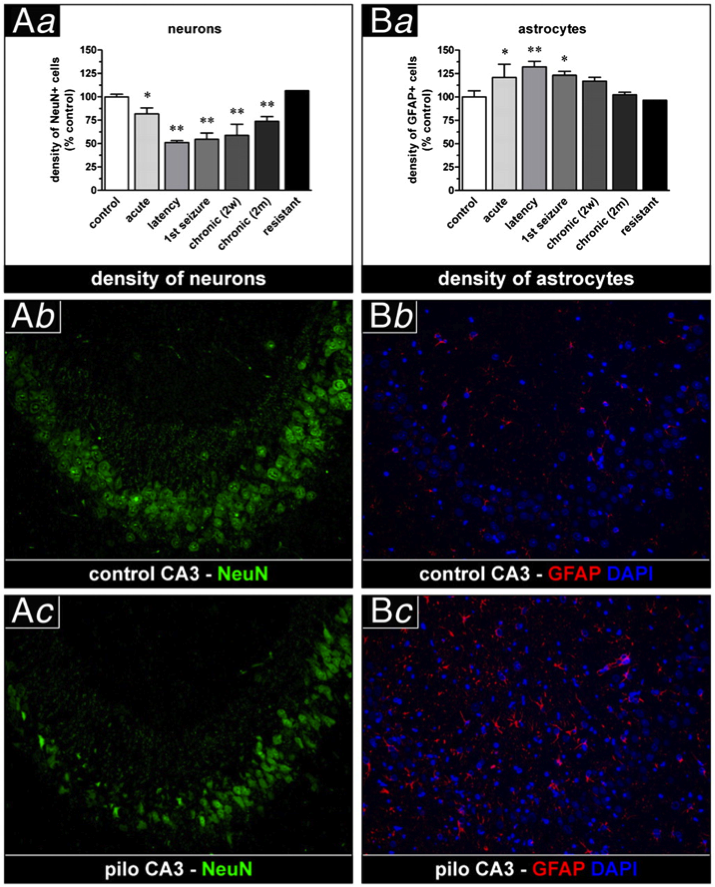
732 KB | Neuronal loss and astrocytosis at various time points after pilo- carpine-induced SE (Mazzuferi et al. 2009) | 1 |
| 15:01, 21 March 2010 | Figure1.png (file) |  |
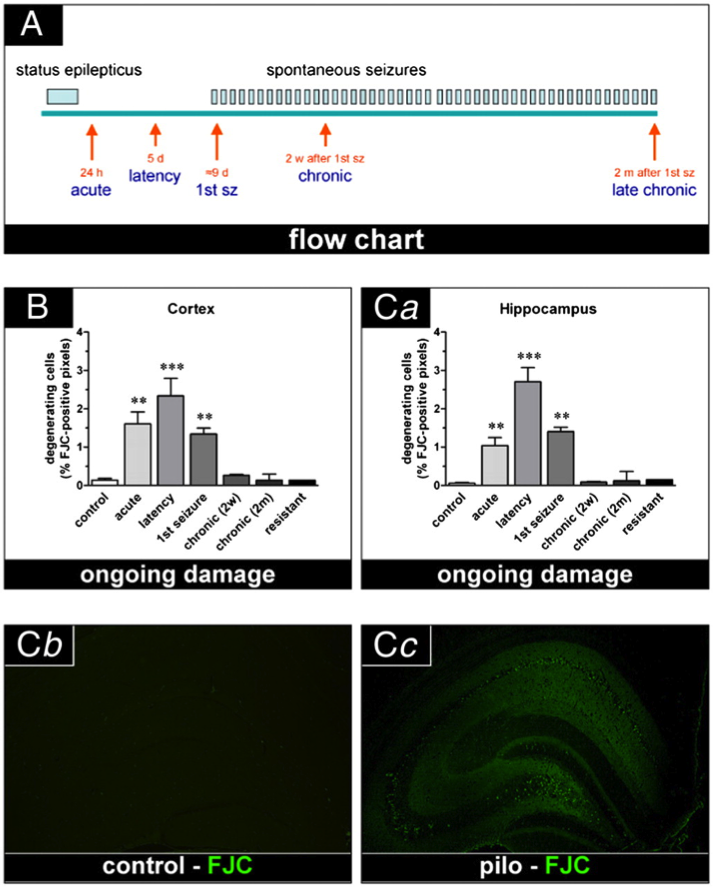
401 KB | Figure 1. (A) Schematic diagram of the in vivo experiments. The time points of analysis are indicated by red arrows. (B) Time course of neurodegeneration in the neocortex. (Ca) Time course of neurodegeneration in the whole hippocampus. (Cb) and (Cc) Repre | 1 |