File list
This special page shows all uploaded files.
First page |
Previous page |
Next page |
Last page |
| Date | Name | Thumbnail | Size | User | Description | Versions |
|---|---|---|---|---|---|---|
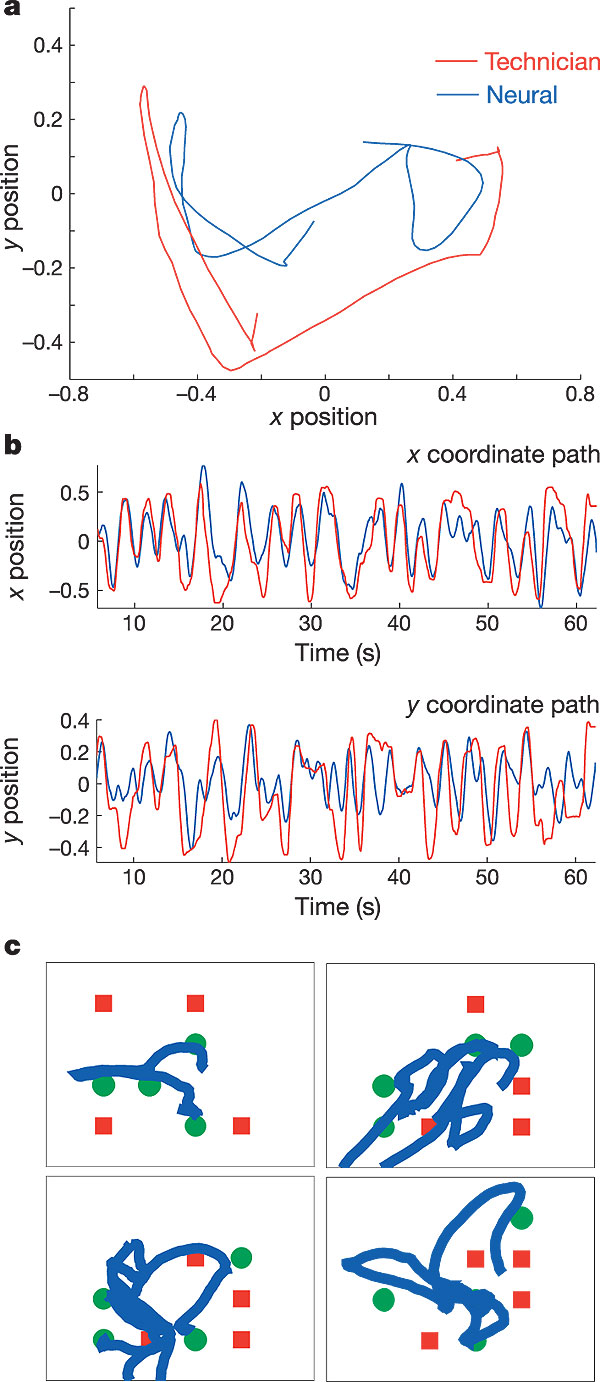
| 15:26, 31 March 2010 | HochbergFig5.jpg (file) |  |
149 KB | Gringovich | 1 | |
| 12:07, 30 January 2008 | WM.png (file) | WM.png | 159 KB | Fredsabb | 2 | |
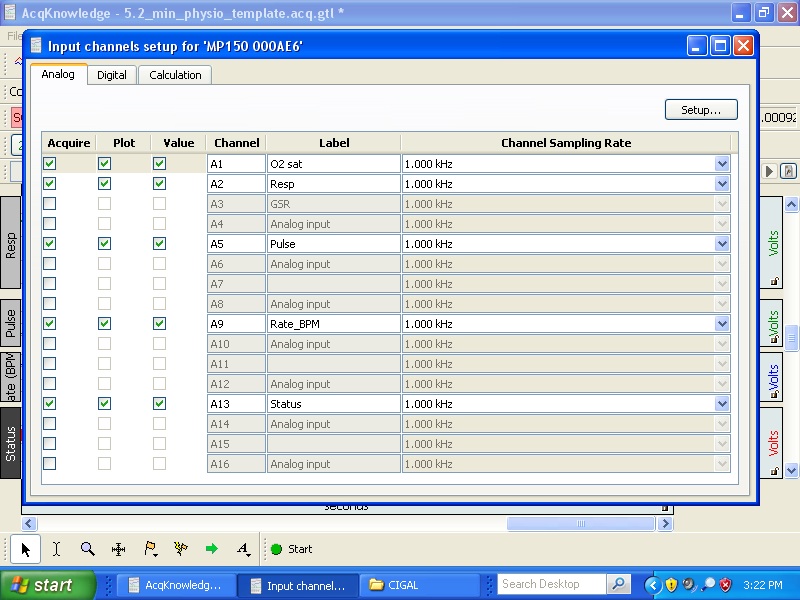
| 12:02, 21 May 2012 | Channels.jpg (file) |  |
160 KB | acq channel setup | 1 | |
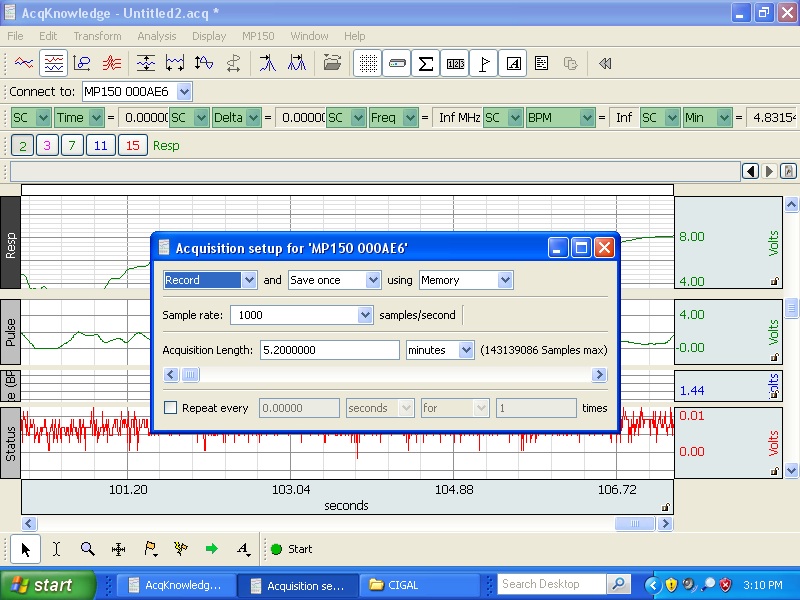
| 12:02, 21 May 2012 | Acquisition bht.jpg (file) |  |
171 KB | acquisition BHT set up | 1 | |
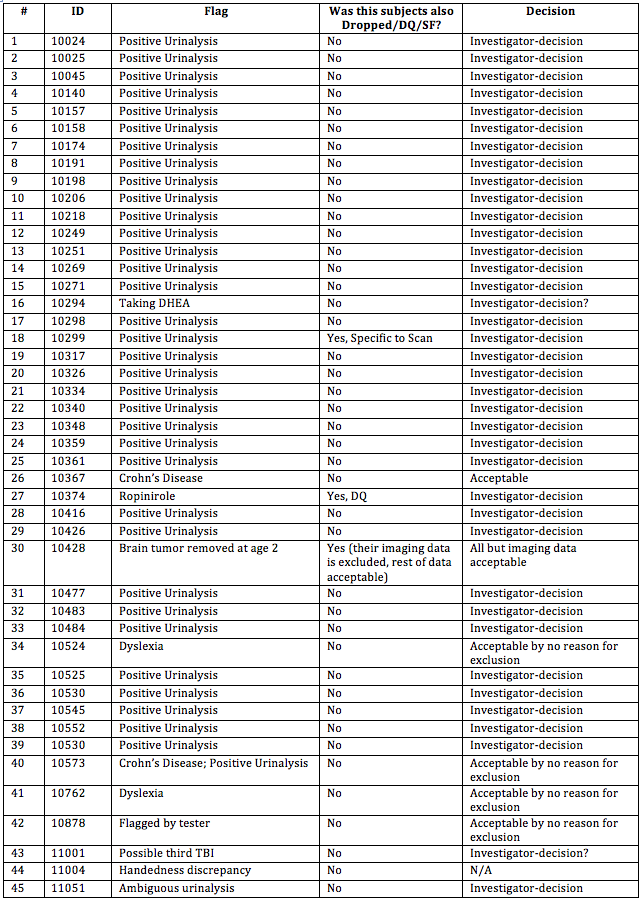
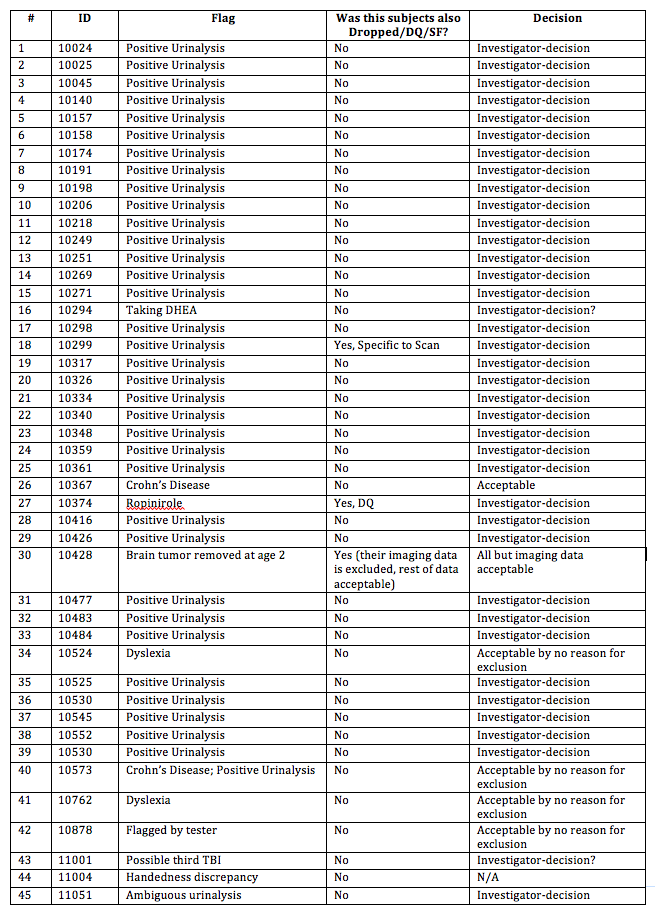
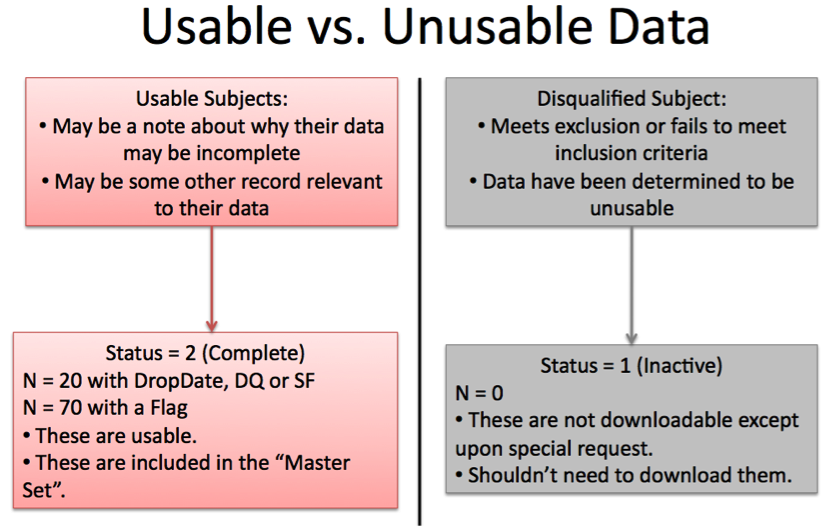
| 12:56, 7 March 2013 | CNP MasterSet Flag Fields1 030713.png (file) |  |
173 KB | Elizac | 1 | |
| 17:19, 6 March 2013 | CNP MasterSet Flag Fields1.png (file) |  |
177 KB | Elizac | 1 | |
| 11:49, 18 April 2011 | Table2.png (file) |  |
181 KB | WikiSysop | 1 | |
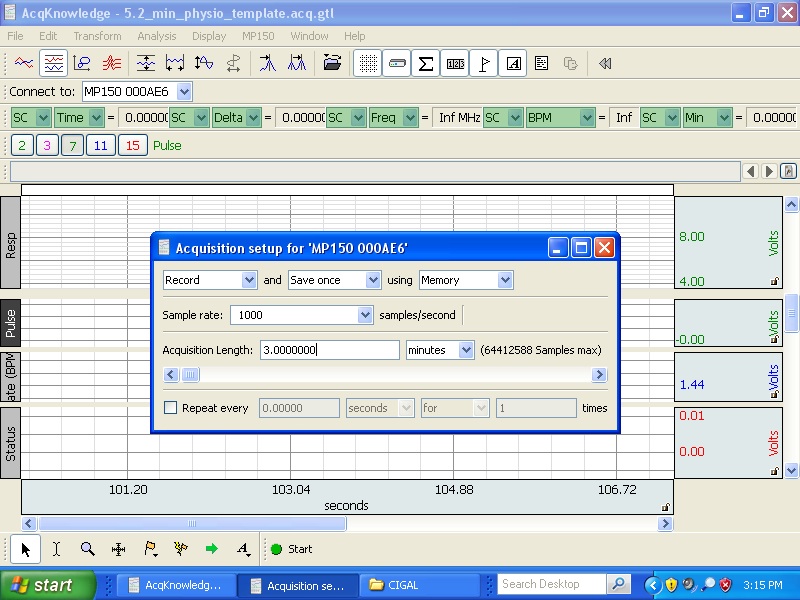
| 12:02, 21 May 2012 | Acquisition.jpg (file) |  |
182 KB | resting state acquisition set up | 1 | |
| 07:47, 14 June 2010 | 3. Vector Floral Ornaments.svg (file) | 3._Vector_Floral_Ornaments.svg | 184 KB | Alanliang | 29 | |
| 12:54, 10 October 2007 | Sabb Fig4.jpg (file) | Sabb_Fig4.jpg | 185 KB | Fredsabb | 1 | |
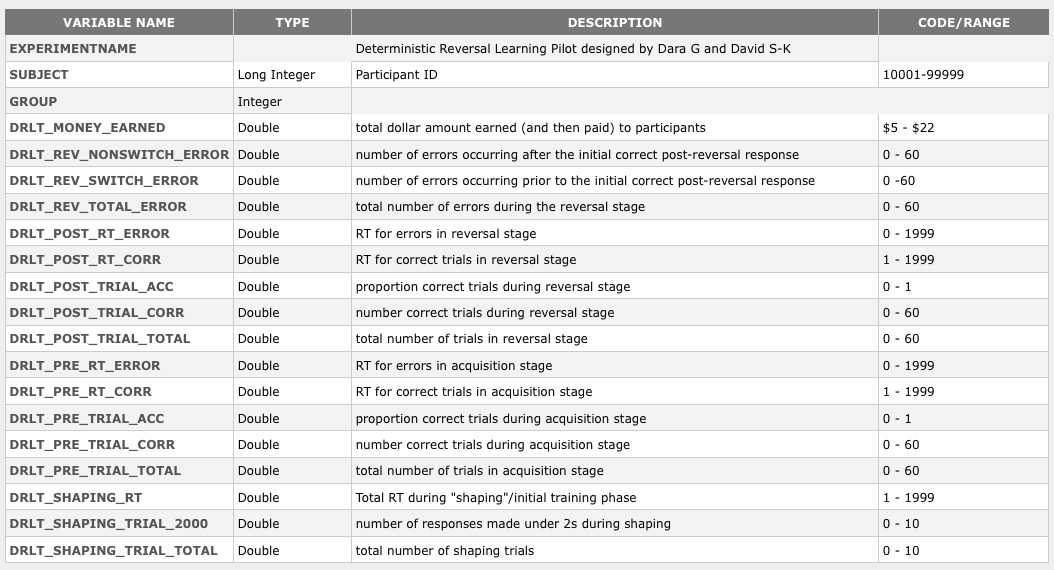
| 21:27, 1 June 2011 | DRLT Variable Table.jpg (file) |  |
196 KB | Stigge | 1 | |
| 21:29, 1 June 2011 | DRLT Variable Table.JPG (file) |  |
196 KB | Stigge | 1 | |
| 13:10, 10 October 2007 | WM.jpg (file) | WM.jpg | 217 KB | Fredsabb | 1 | |
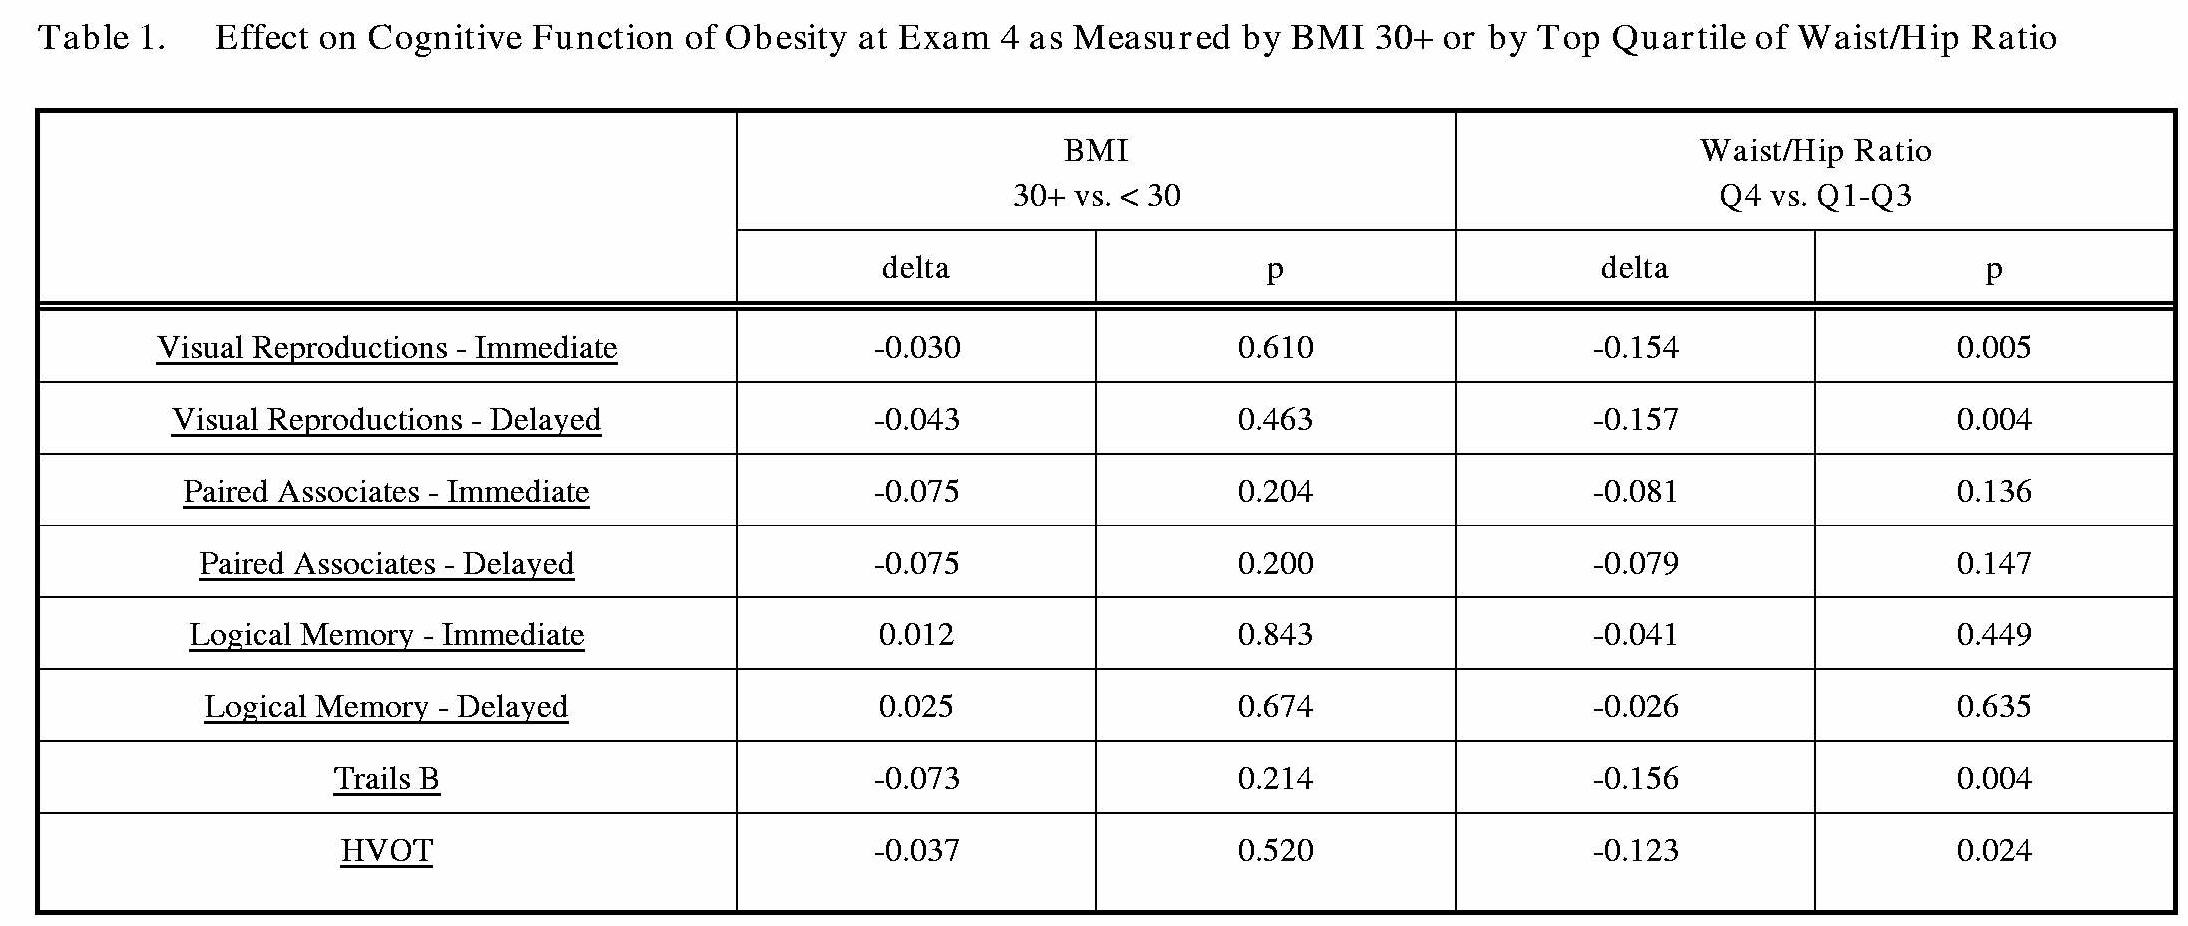
| 18:28, 11 February 2010 | Obesity and cognition.jpg (file) |  |
220 KB | Fredsabb | 1 | |
| 12:34, 7 March 2013 | CNP FinalSamples 2 030713.png (file) |  |
225 KB | Elizac | 1 | |
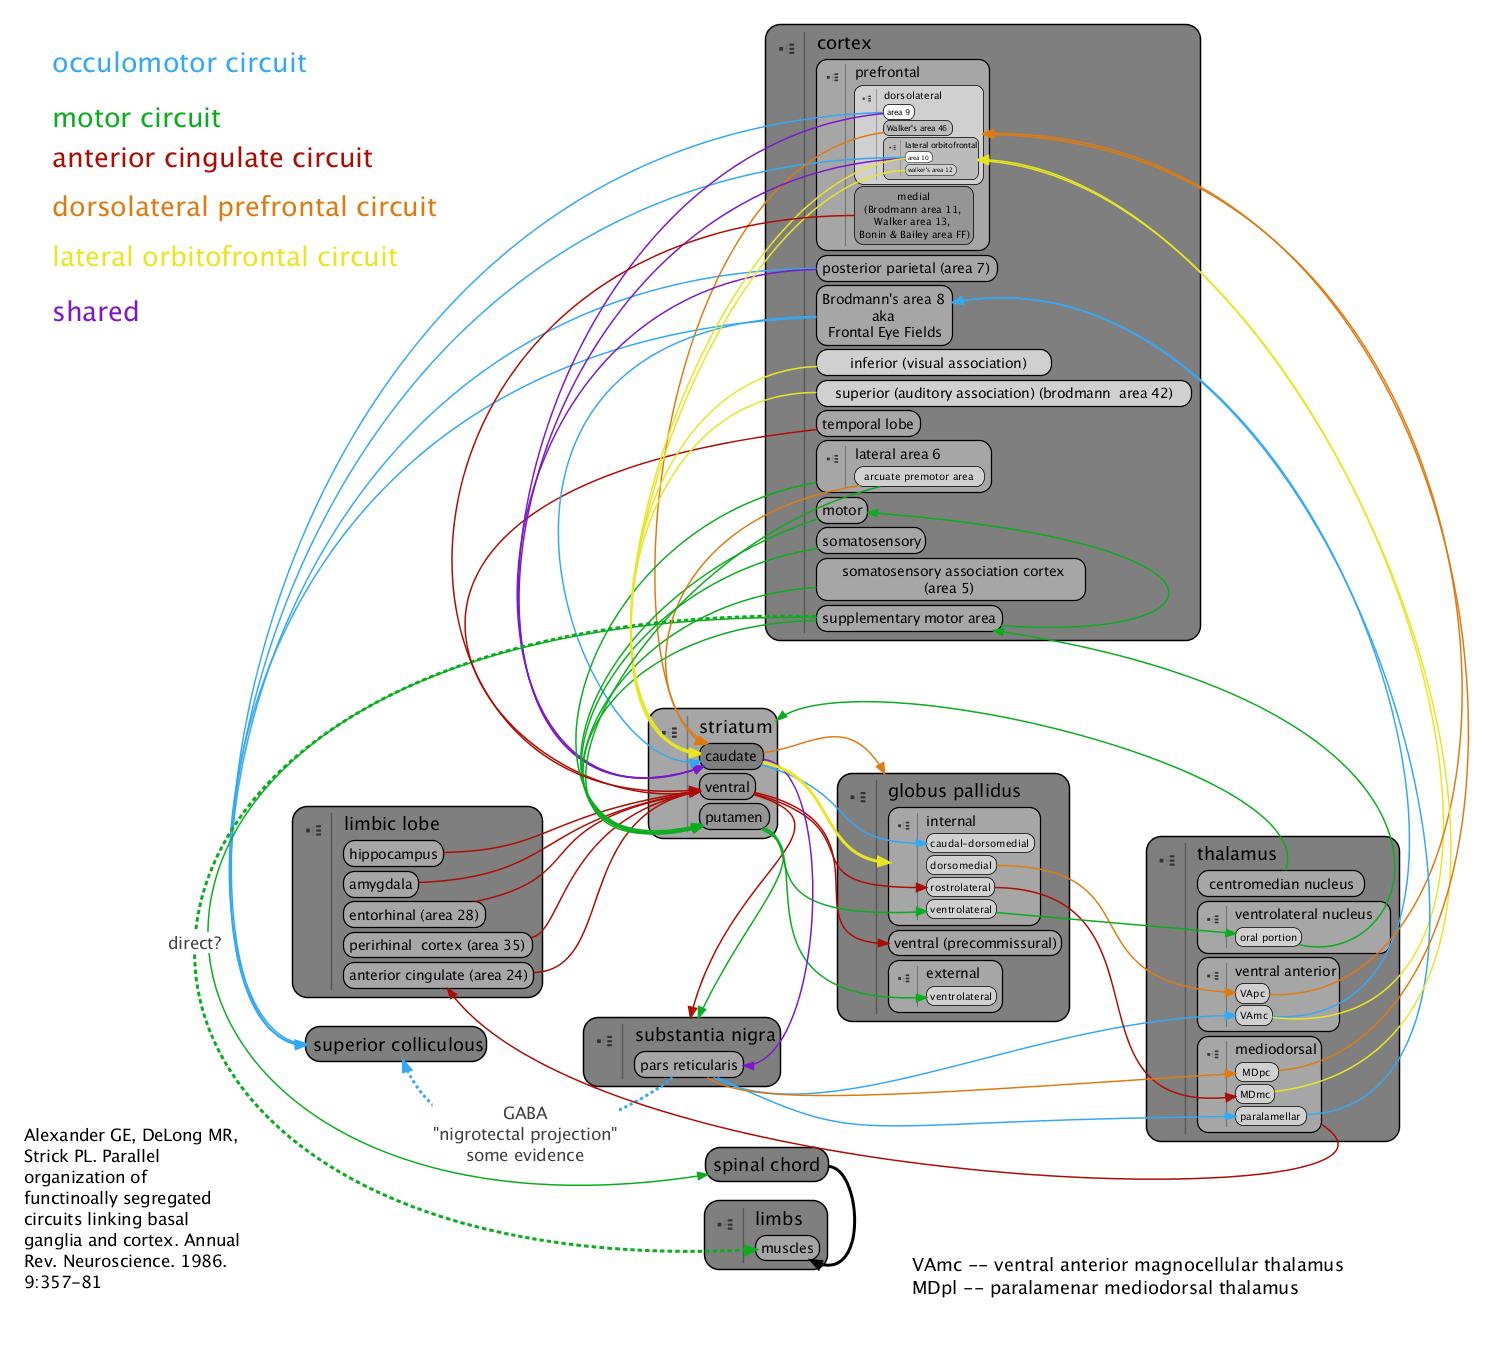
| 10:48, 11 January 2010 | Alexander-et-al-unified-compacted-copy.jpeg (file) |  |
237 KB | Ahowe | Alelexander et al (1986) describe the parallel circuitry in the cortico-striatal-thalmic loop as a set of parallel circuits for processing information from several sensory modalities. | 1 |
| 22:08, 5 June 2011 | LA2K RL screenshot stims.jpg (file) |  |
237 KB | DaraG | LA2K RL screenshot: stimulus presentation | 1 |
| 22:09, 5 June 2011 | LA2K RL screenshot pos fdbk.jpg (file) |  |
245 KB | DaraG | LA2K RL screenshot: positive feedback presentation | 1 |
| 22:09, 5 June 2011 | LA2K RL screenshot neg fdbk.jpg (file) |  |
246 KB | DaraG | LA2K RL screenshot: positive feedback presentation | 1 |
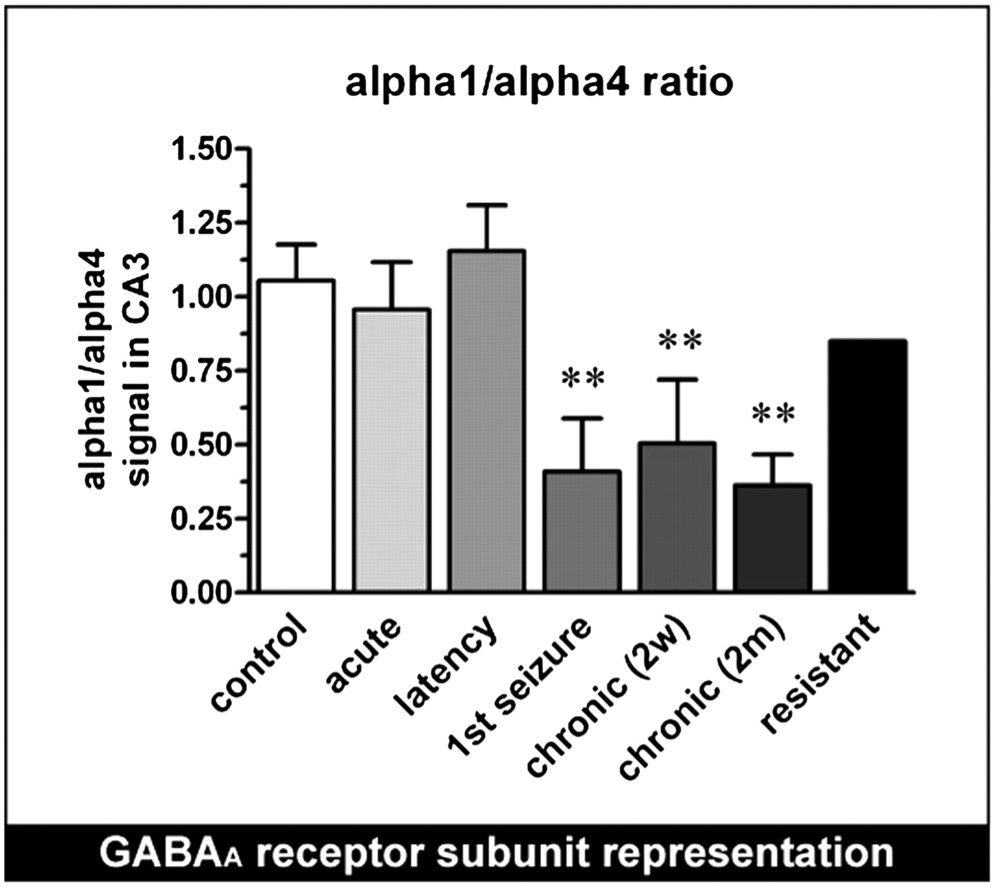
| 15:18, 21 March 2010 | Figure5.png (file) |  |
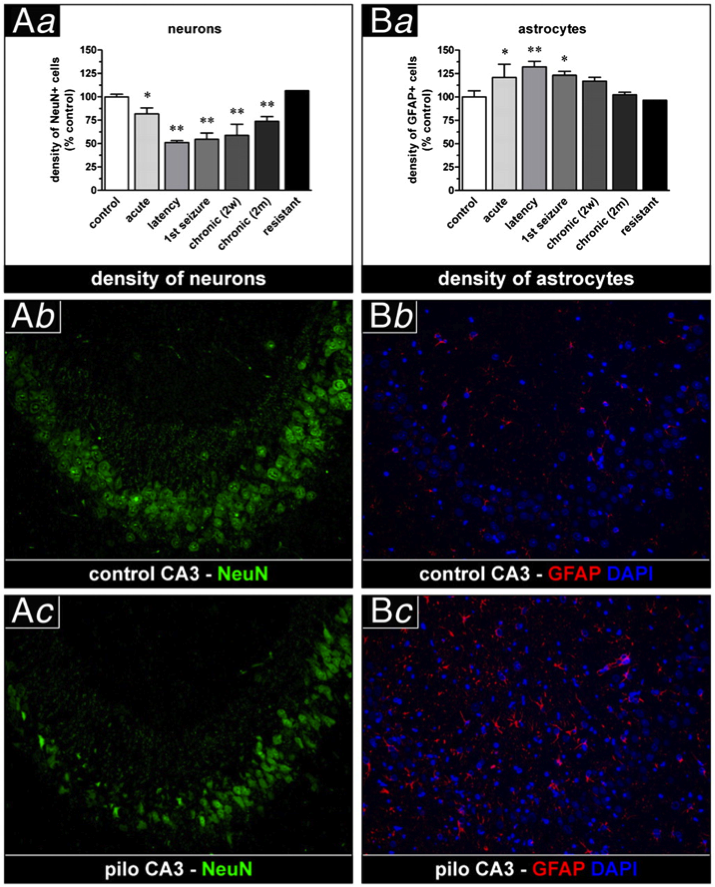
248 KB | Derekverley | Figure 5. Relative representation of the alpha1 and alpha4 subunits in CA3, at various time points after pilocarpine-induced SE (Mazzuferi 2010) | 1 |
| 13:10, 18 April 2011 | Slide4.png (file) |  |
248 KB | WikiSysop | 1 | |
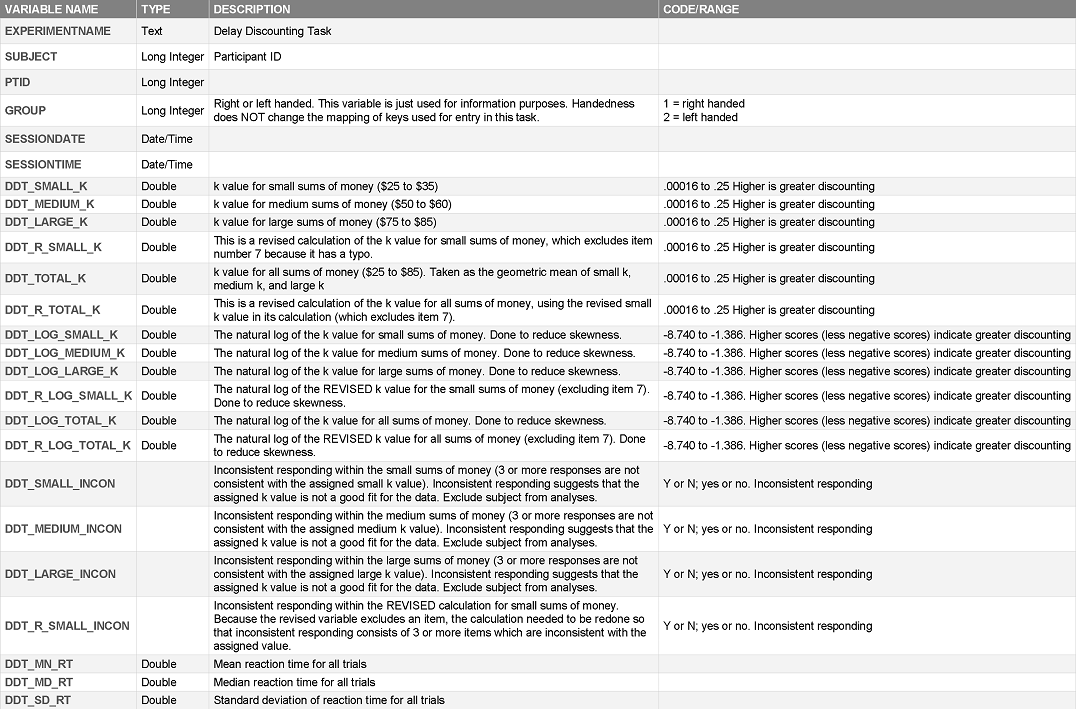
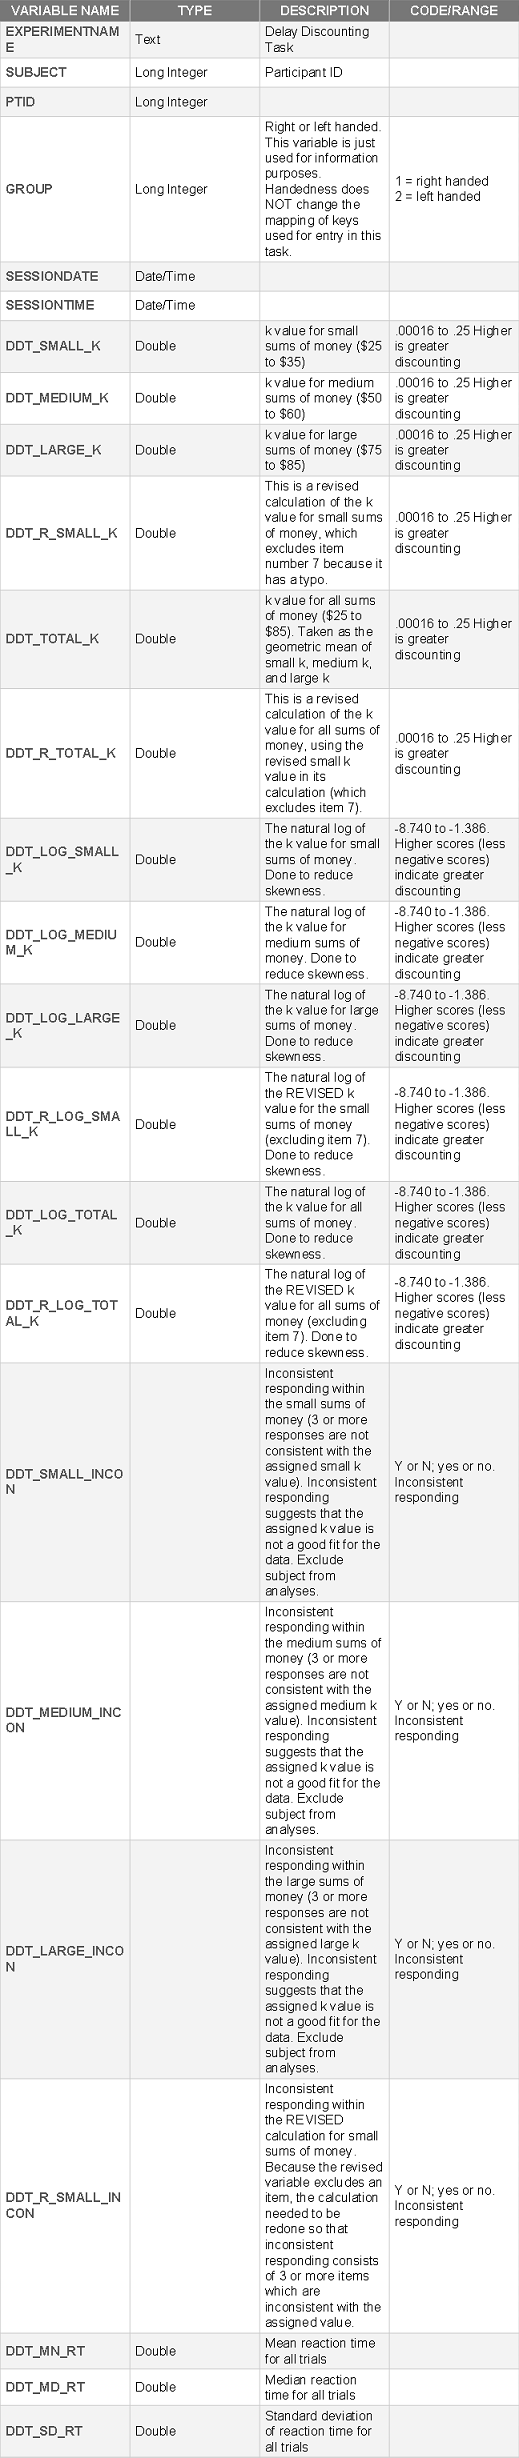
| 14:39, 20 July 2011 | DDTvariables2.png (file) |  |
251 KB | Acdean | 1 | |
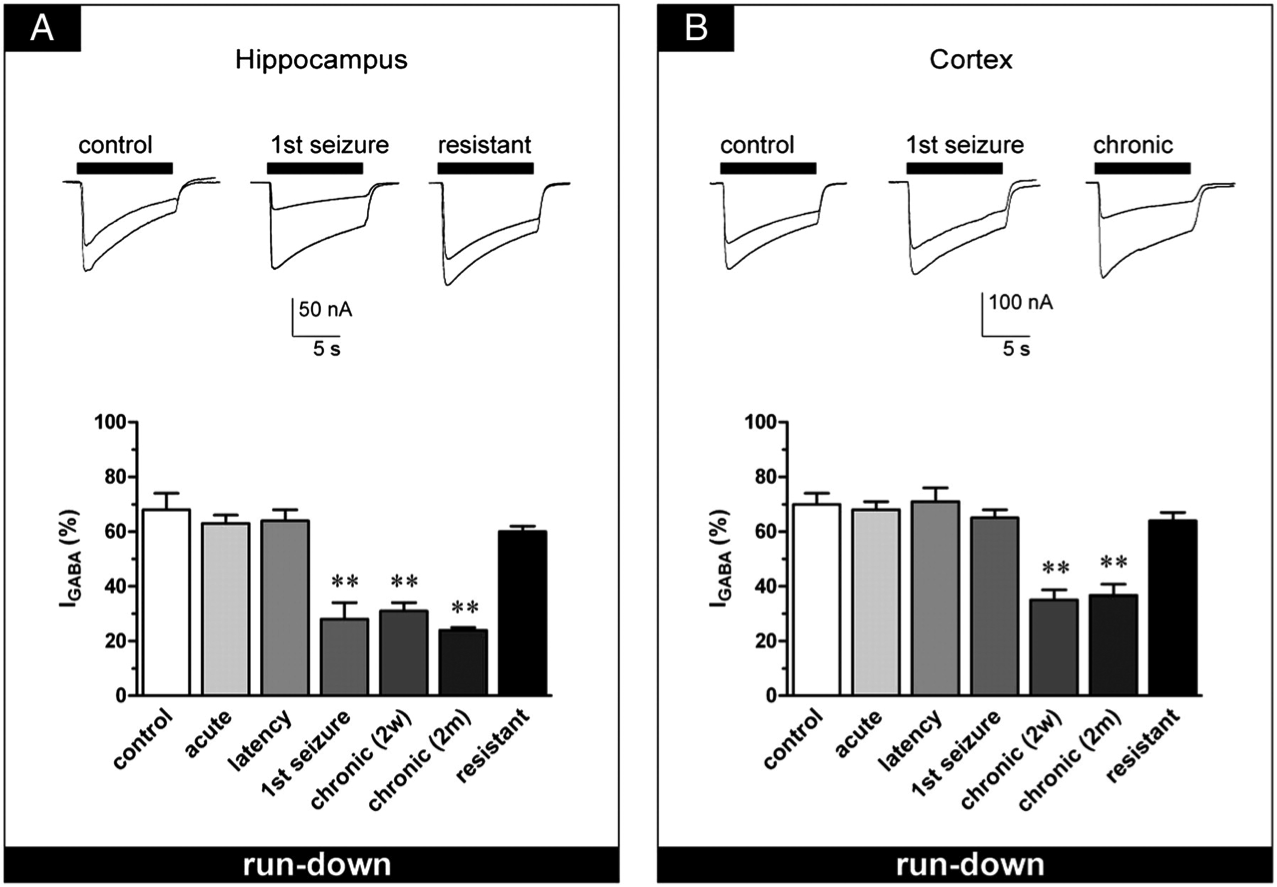
| 15:06, 21 March 2010 | Figure3.png (file) |  |
253 KB | Derekverley | Figure 3. IGABA run-down from oocytes injected with membranes prepared from rats killed at various time points after pilocarpine-induced SE (Mazzuferi et al. 2009) | 1 |
| 15:41, 23 March 2010 | Human genome.png (file) |  |
254 KB | Deanna | 1 | |
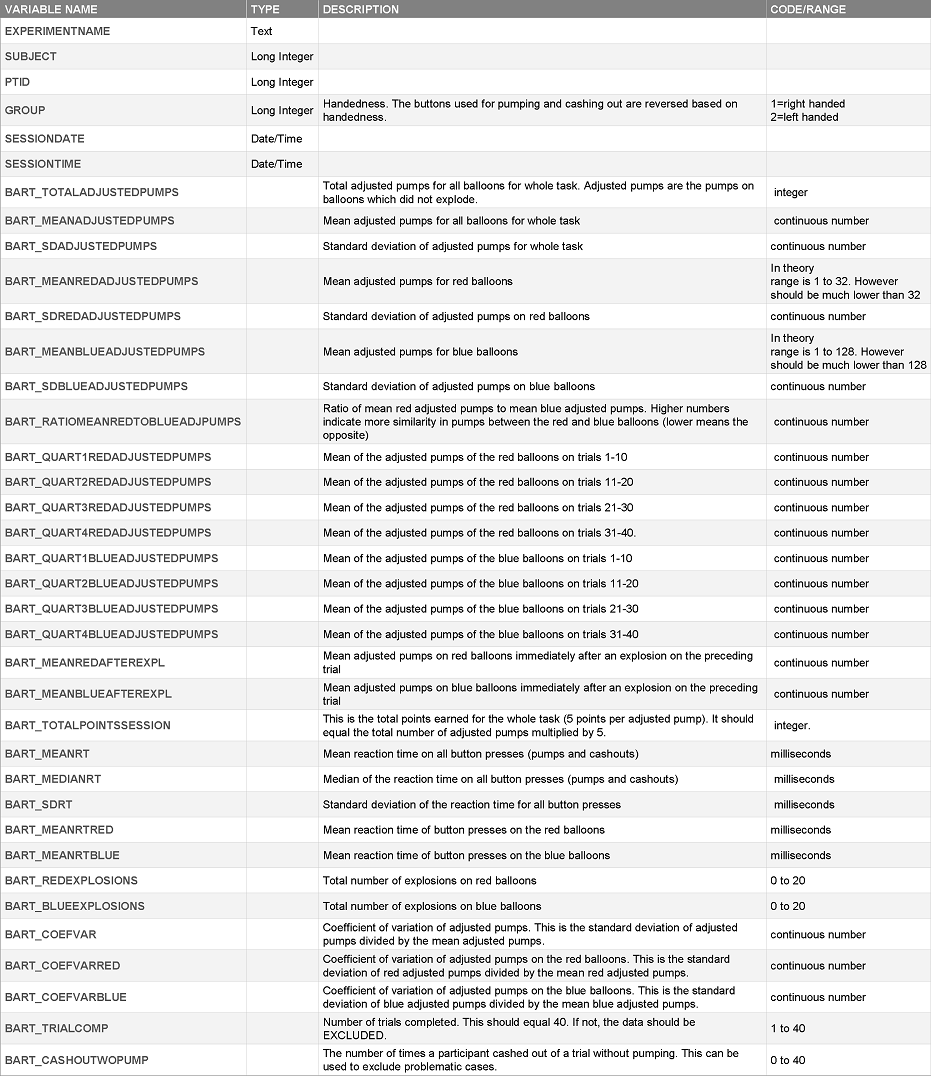
| 14:59, 20 July 2011 | BARTvariables2.PNG (file) |  |
291 KB | Acdean | 2 | |
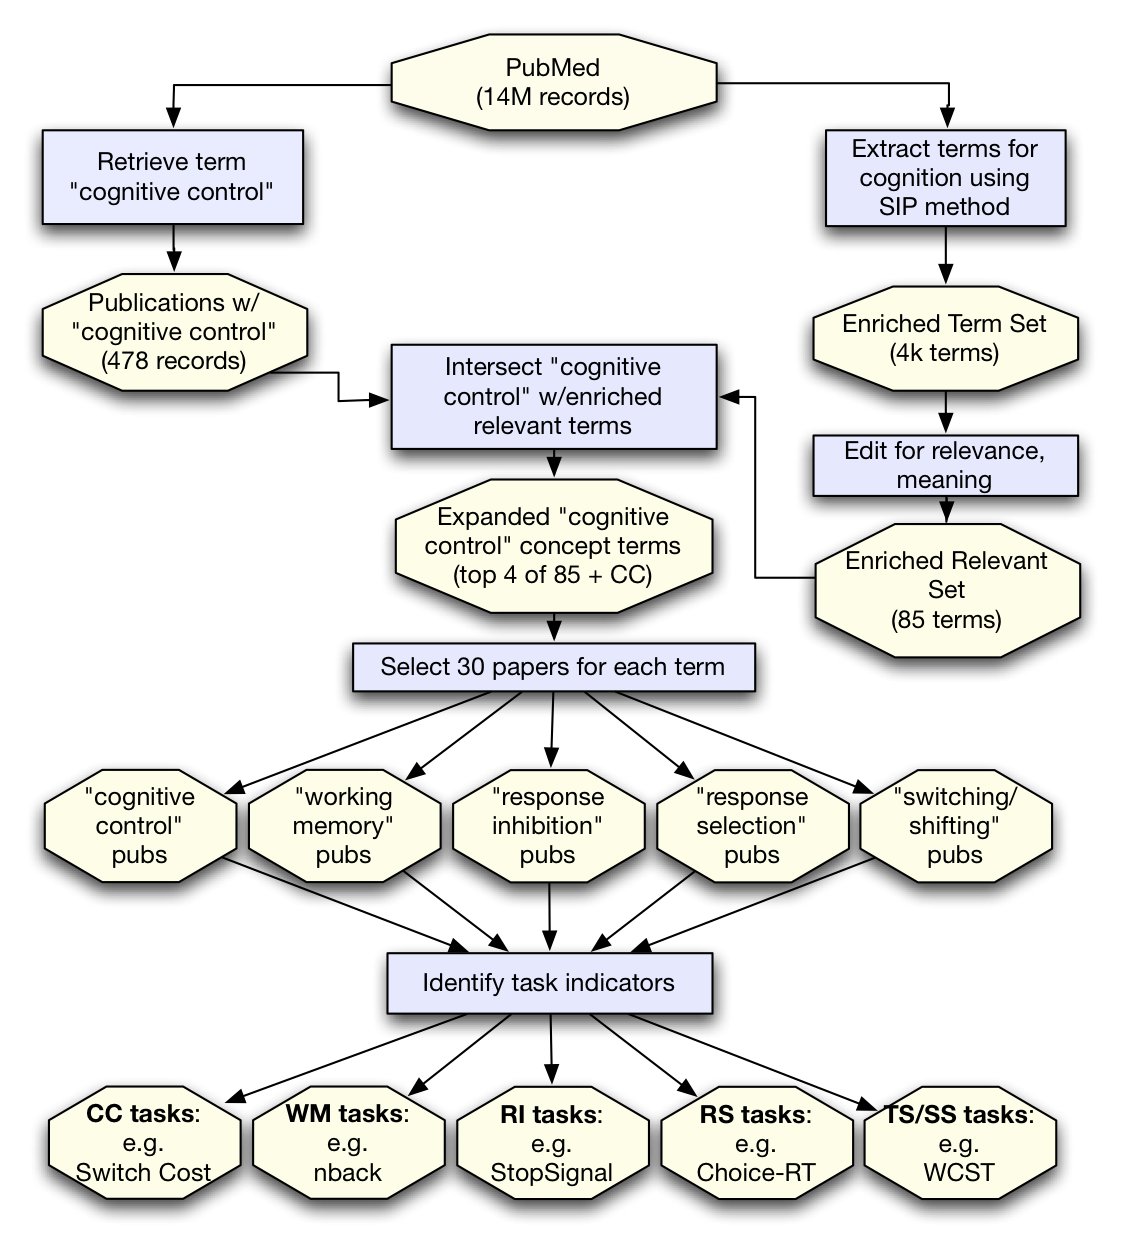
| 12:09, 8 January 2010 | Sabb4.png (file) |  |
297 KB | Fredsabb | 1 | |
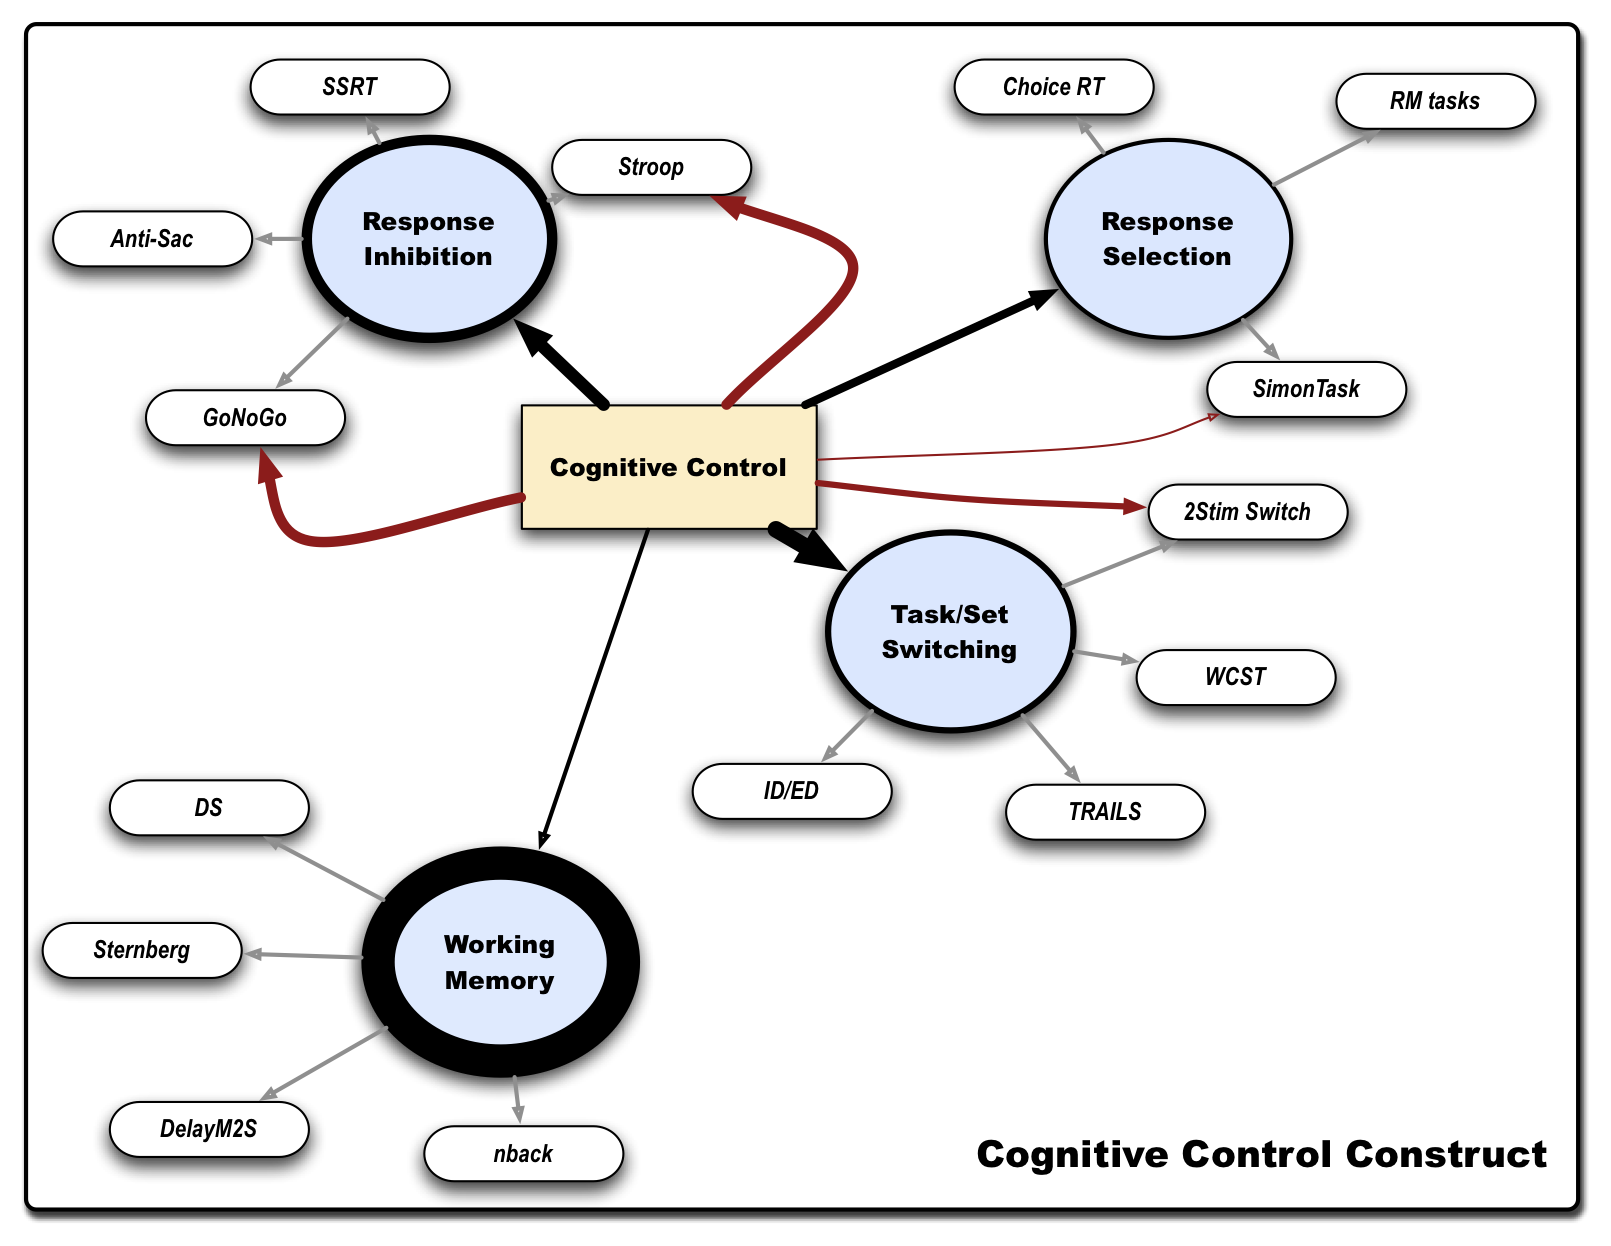
| 20:19, 8 October 2007 | CCnew.jpg (file) | CCnew.jpg | 308 KB | Fredsabb | 2 | |
| 20:22, 8 October 2007 | CCnew2.jpg (file) | CCnew2.jpg | 308 KB | Fredsabb | 1 | |
| 11:53, 8 January 2010 | Sabb2.png (file) |  |
323 KB | Fredsabb | 1 | |
| 20:28, 8 October 2007 | STA 0078.jpg (file) | STA_0078.jpg | 328 KB | Fredsabb | test file | 1 |
| 09:54, 9 June 2010 | Chemicals in flasks.jpg (file) |  |
330 KB | Deanna | 1 | |
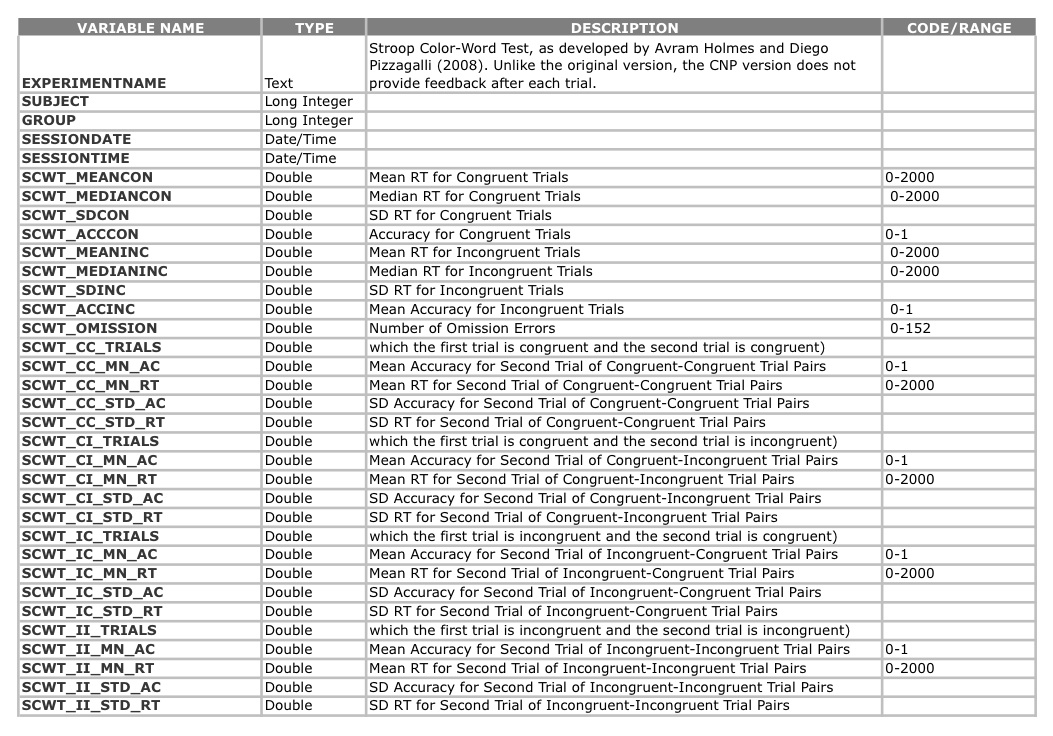
| 12:31, 27 June 2011 | SCWT Variables.JPG (file) |  |
338 KB | Stigge | 1 | |
| 15:16, 19 July 2011 | DDTvariablestable.png (file) |  |
344 KB | Acdean | 3 | |
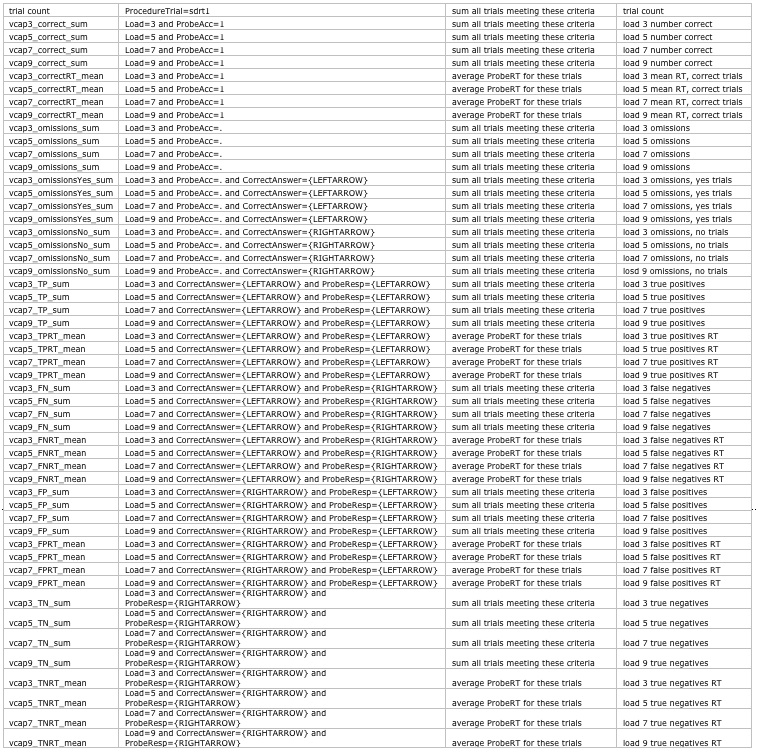
| 11:53, 22 June 2011 | Vcap variables.jpg (file) |  |
349 KB | Katie | 1 | |
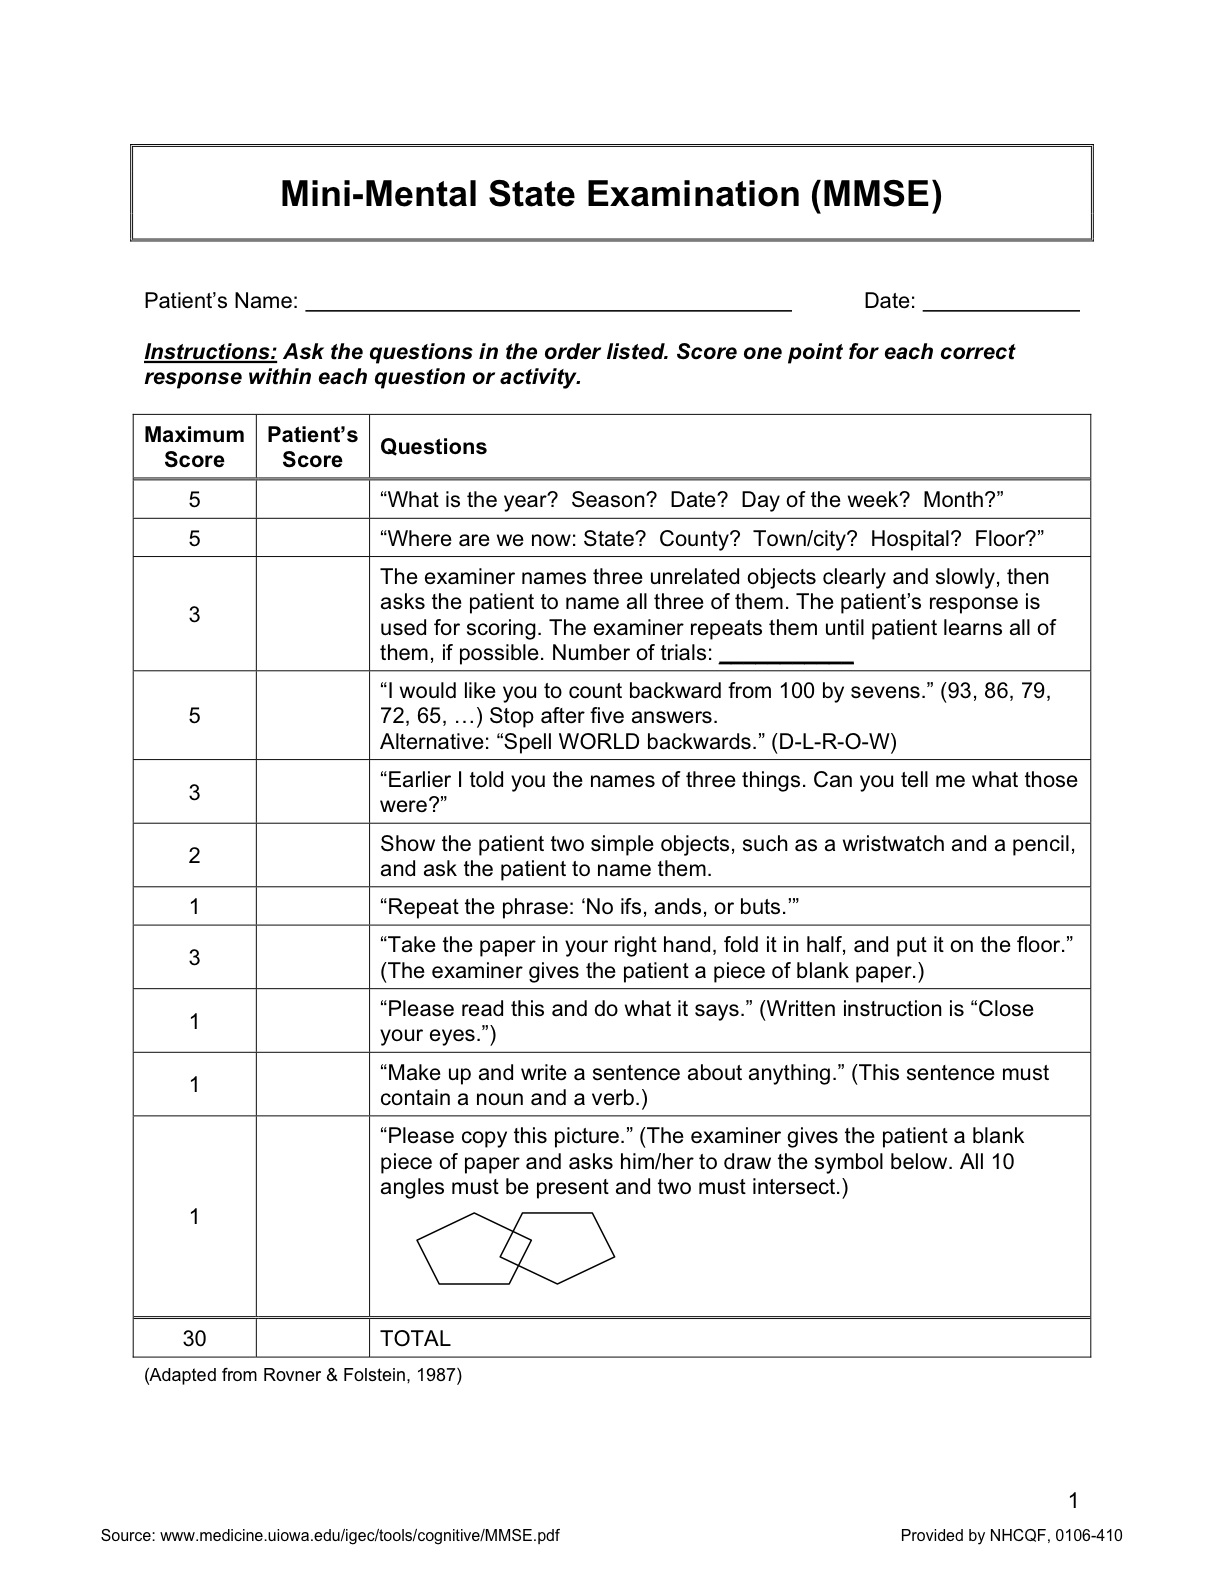
| 18:17, 11 February 2010 | MMSE.jpg (file) |  |
358 KB | Fredsabb | 1 | |
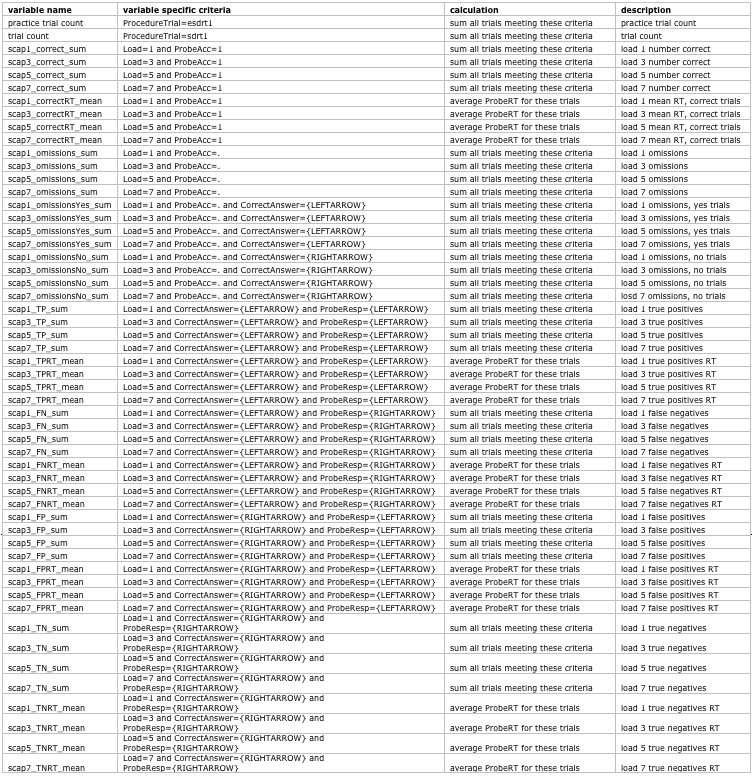
| 16:33, 21 June 2011 | Scap variables.jpg (file) |  |
359 KB | Katie | 1 | |
| 10:25, 19 January 2010 | Kd1.png (file) |  |
370 KB | Fredsabb | 1 | |
| 13:09, 25 March 2010 | Flores2.gif (file) |  |
372 KB | Deanna | 1 | |
| 11:05, 20 May 2010 | 2. Vector Floral Ornaments.svg (file) | 2._Vector_Floral_Ornaments.svg | 388 KB | Deanna | 8 | |
| 13:11, 25 March 2010 | Flores.gif (file) |  |
397 KB | Deanna | 3 | |
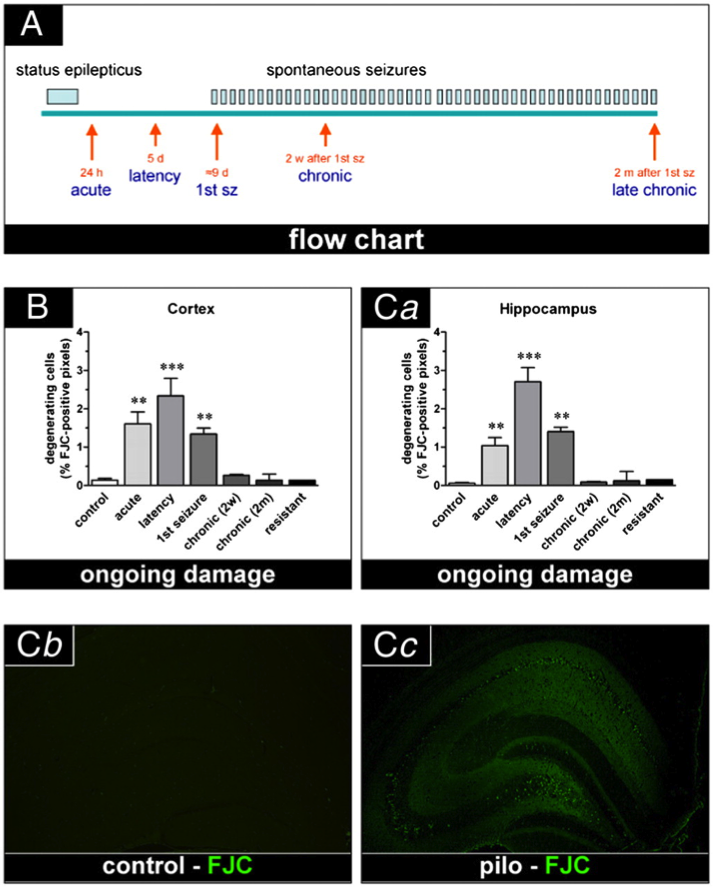
| 15:01, 21 March 2010 | Figure1.png (file) |  |
401 KB | Derekverley | Figure 1. (A) Schematic diagram of the in vivo experiments. The time points of analysis are indicated by red arrows. (B) Time course of neurodegeneration in the neocortex. (Ca) Time course of neurodegeneration in the whole hippocampus. (Cb) and (Cc) Repre | 1 |
| 13:10, 18 April 2011 | Slide5.png (file) |  |
426 KB | WikiSysop | 1 | |
| 17:43, 18 July 2011 | Ts schema.png (file) |  |
460 KB | WikiSysop | screen captured off my machine -fws | 1 |
| 09:11, 9 June 2010 | SMOK.svg (file) | SMOK.svg | 516 KB | Deanna | 3 | |
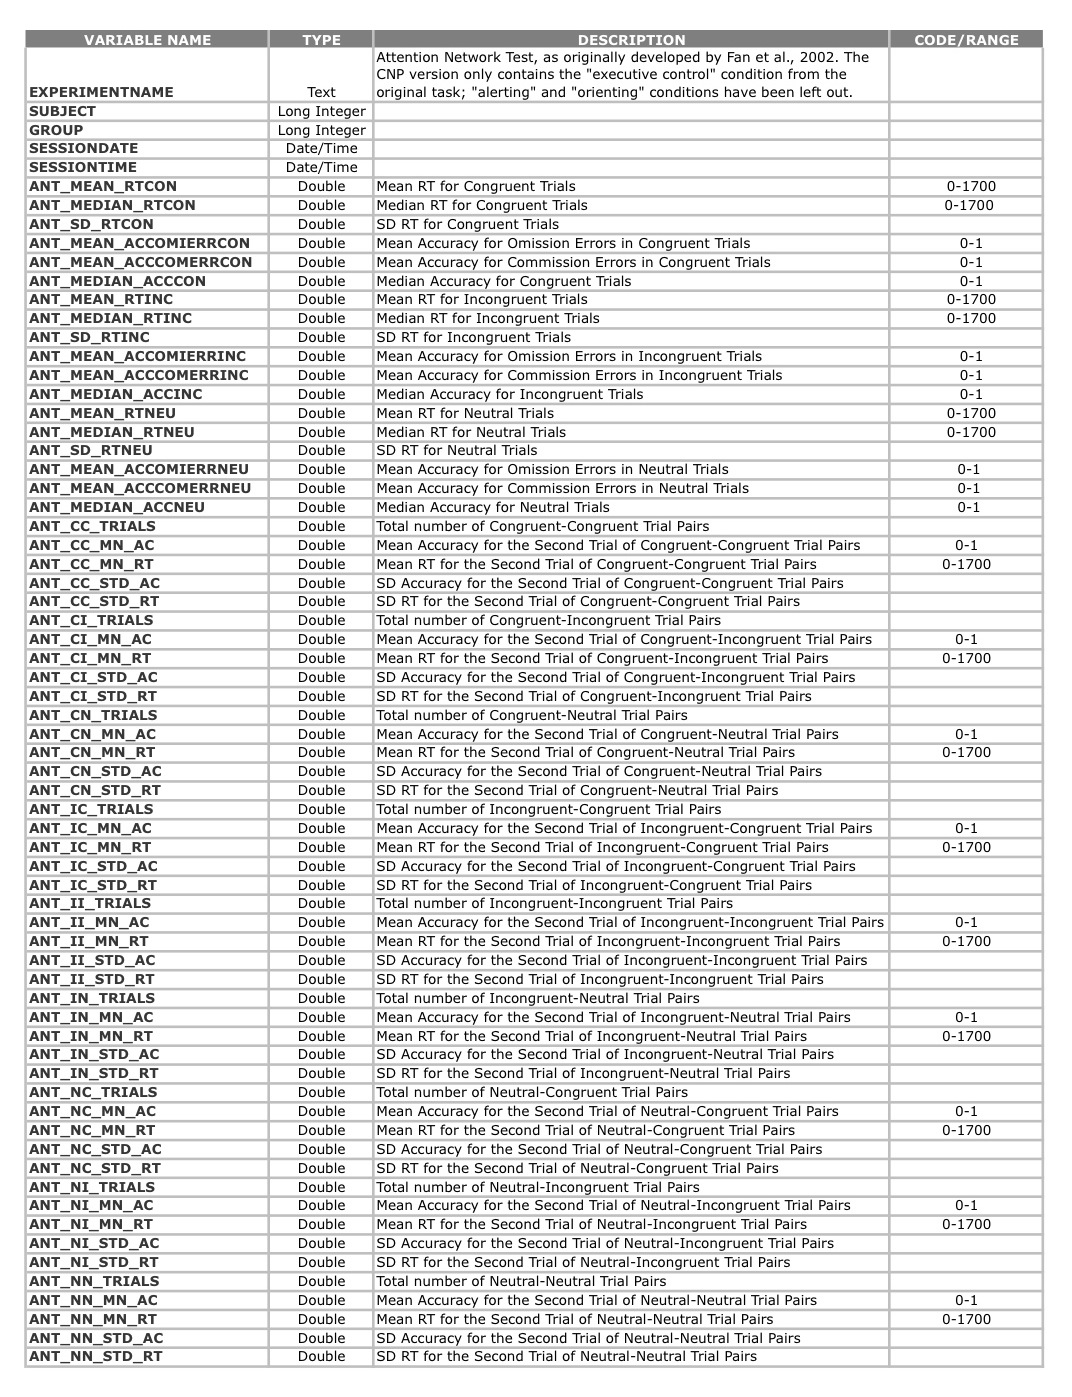
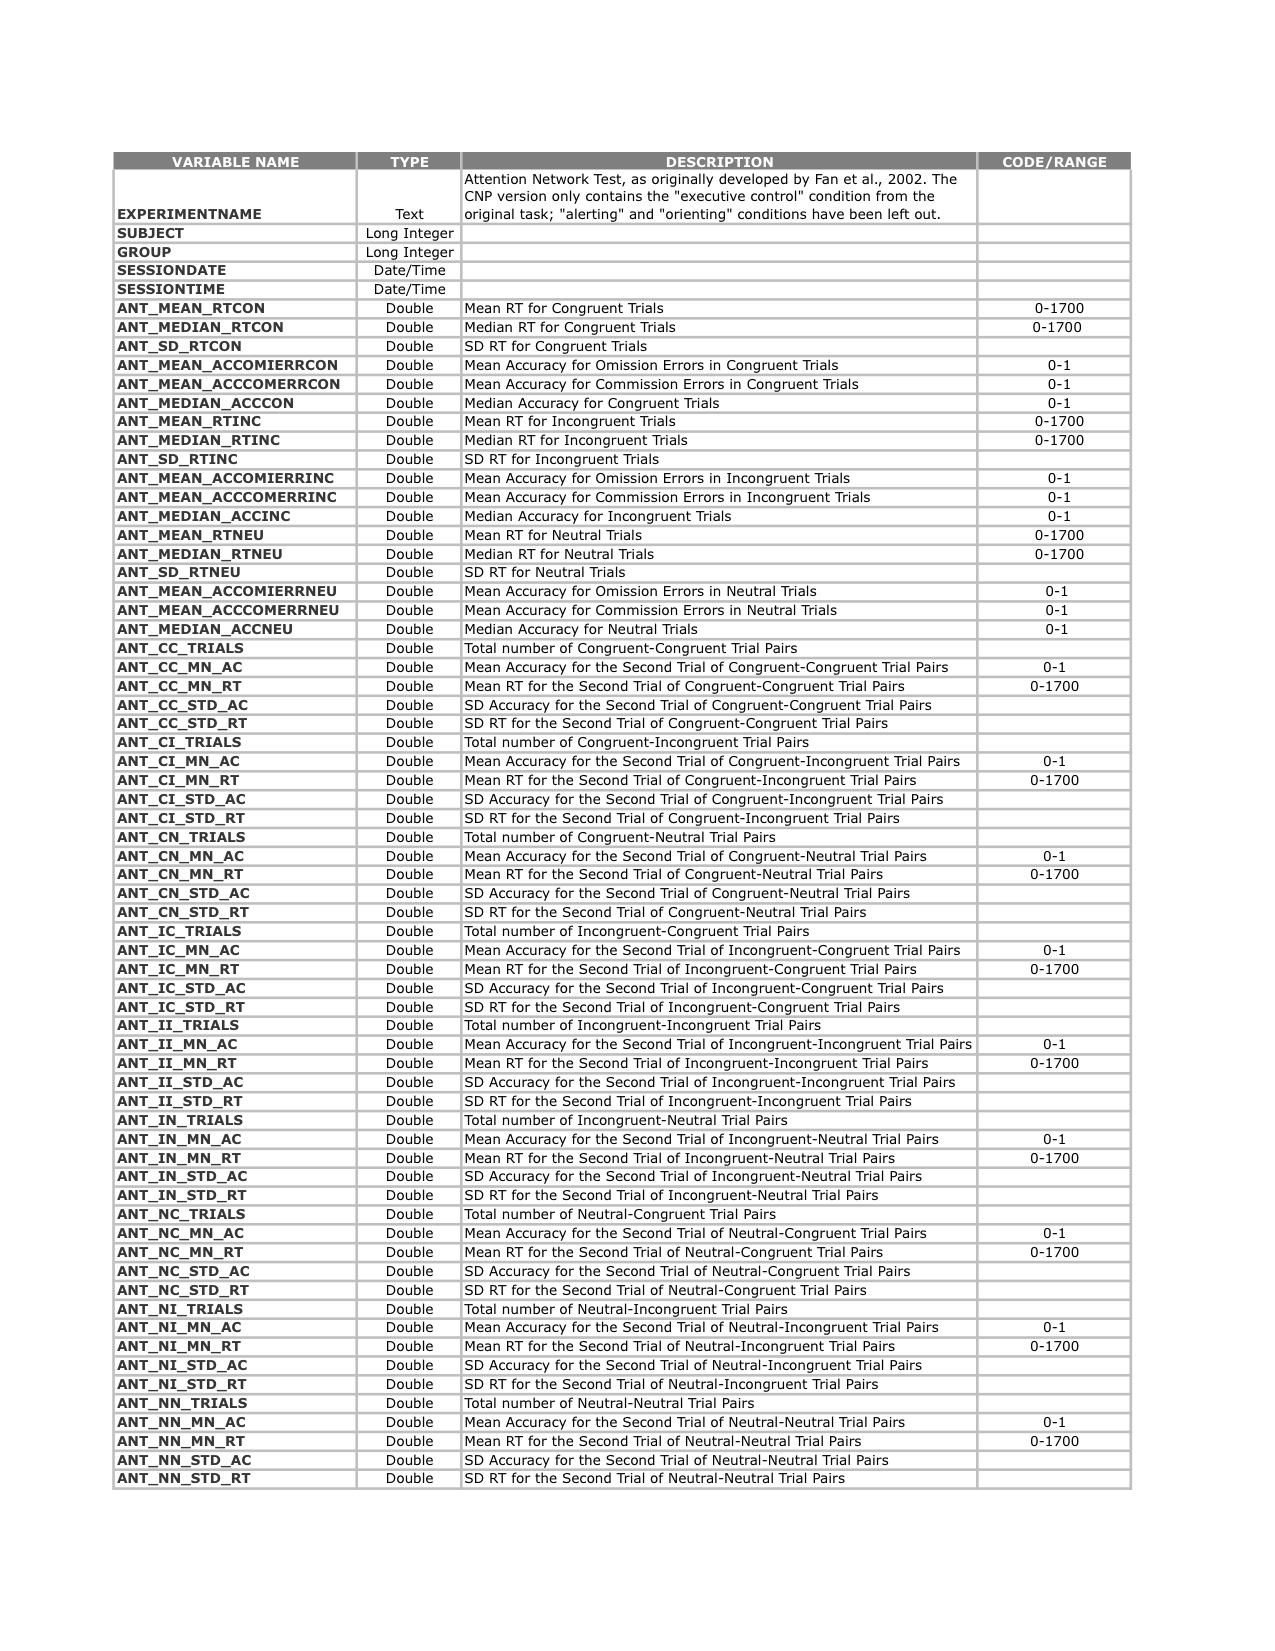
| 12:05, 27 June 2011 | ANT Variables.jpg (file) |  |
646 KB | Stigge | 1 | |
| 15:47, 27 October 2009 | Brain MRI T1 movie.gif (file) |  |
650 KB | Deanna | Reverted to version as of 22:42, 27 October 2009 | 3 |
| 15:04, 21 March 2010 | Figure2.png (file) |  |
732 KB | Derekverley | Neuronal loss and astrocytosis at various time points after pilo- carpine-induced SE (Mazzuferi et al. 2009) | 1 |
| 11:46, 27 June 2011 | ANT Variables.JPG (file) |  |
790 KB | Stigge | 1 | |
| 12:10, 8 January 2010 | Sabb4.jpg (file) |  |
894 KB | Fredsabb | 1 | |
| 12:14, 14 January 2010 | 1897scroll.svg (file) | Error creating thumbnail: /bin/bash: convert: command not found |
2.56 MB | Deanna | 2 |
First page |
Previous page |
Next page |
Last page |