File:Figure1.png
From Pheno Wiki
Size of this preview: 482 × 600 pixels. Other resolutions: 193 × 240 pixels | 713 × 887 pixels.
Original file (713 × 887 pixels, file size: 401 KB, MIME type: image/png)
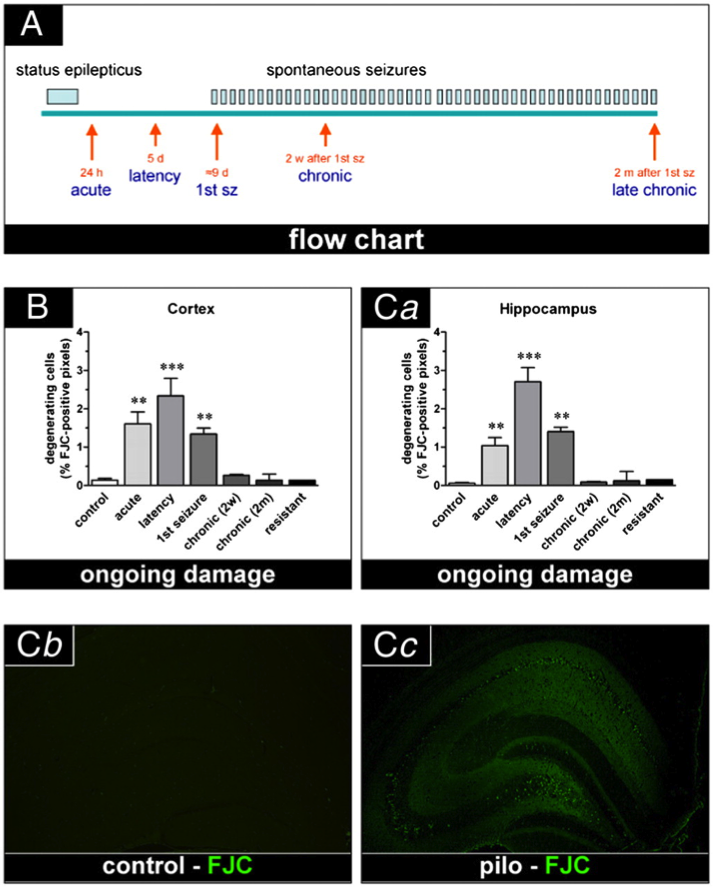
Figure 1. (A) Schematic diagram of the in vivo experiments. The time points of analysis are indicated by red arrows. (B) Time course of neurodegeneration in the neocortex. (Ca) Time course of neurodegeneration in the whole hippocampus. (Cb) and (Cc) Representative images of the effect of pilocarpine SE on degeneration in the hippocampus. (Mazzuferi et al. 2010)
File history
Click on a date/time to view the file as it appeared at that time.
| Date/Time | Thumbnail | Dimensions | User | Comment | |
|---|---|---|---|---|---|
| current | 15:01, 21 March 2010 | | 713 × 887 (401 KB) | Derekverley (Talk | contribs) | Figure 1. (A) Schematic diagram of the in vivo experiments. The time points of analysis are indicated by red arrows. (B) Time course of neurodegeneration in the neocortex. (Ca) Time course of neurodegeneration in the whole hippocampus. (Cb) and (Cc) Repre |
File usage
The following page links to this file: